import wooldridge as woo
import numpy as np
import pandas as pd
import matplotlib.pyplot as pltWorking with Jupyter Notebook
The following example is based on Script Descr-Figures from Chapter 2 and demonstrates the use of Jupyter Notebooks to document your work step by step. We will describe the two most important building blocks:
- basic Markdown commands to format your text in
Markdowncells - how to import and run Python code in
Codecells
Import and Prepare Data
Let’s start by importing all external modules:
In the next step, we import our data and define important variables:
affairs = woo.dataWoo('affairs')

# use a pandas.Categorical object to attach labels:
affairs['haskids'] = pd.Categorical.from_codes(affairs['kids'],
                                               categories=['no', 'yes'])
counts = affairs['haskids'].value_counts()
Analyse Data
View your Data
To get an overview you could use affairs.head().
Calculate Descriptive Statistics
Up to this point, the code cells above produced no output. This will change now, as we are interested in some results. Let’s start with printing out the average age. We start with its definition and use LaTeX to enter the equation: \[ \bar{x} = \frac{1}{N} \sum_{i=1}^N x_{i} \] The resulting Python code gives:
age_mean = np.mean(affairs['age'])
print(age_mean)32.48752079866888Produce Graphic Results
In Chapter 2, we saw how to produce a pie chart. Let’s repeat it here:
plot = plt.pie(counts, labels=['no', 'yes'])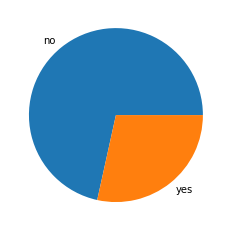
You can also show Python code without executing it. You can use inline code, or for longer paragraphs
plt.bar(['no', 'yes'], counts, color='dimgrey')